Going big in the house-building market
Back in 2006,1 we looked at the developing trend towards volume builders that had appeared in consent data over the previous decade. Market conditions for the residential building sector have been exceptionally weak between 2008 and 2012, negatively affecting construction firms right across the spectrum, but volume builders have started staging a healthy recovery over the last two years.
Our assessment of the market between 1997 and 2006 was that “the larger firms have tended to hold their own (in terms of market share) during the downturns, and expanded their market share during the upturns.” But when residential building activity collapsed by 37% during the March 2009 year, the drop was felt more keenly among the larger firms. Between March 2007 and March 2010, the market share of firms building 40 or more houses per year dropped from 29.1% to 22.7%, its lowest level since 2001. The crunch in building activity was too much for even the largest firms to withstand.
However, there has been a massive swing back towards larger builders again over the last couple of years. Graph 5.6 shows that the market share of firms building 80 or more houses per year surged from 18.7% to a record high of 27.8% between March 2011 and March 2013. Among the ten largest firms, Stonewood Homes, Mike Greer Homes, Ryman Healthcare, Classic Builders, Signature Homes, and Horncastle Homes have all reached their highest annual build rates and/or their highest market shares on record in the last year.
Graph 5.6
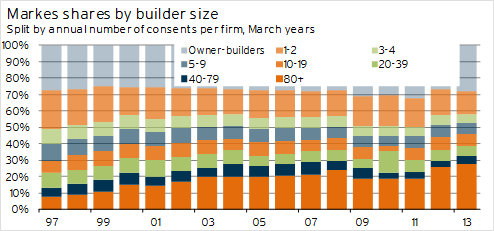
In the case of some of these firms (eg Stonewood Homes, Mike Greer Homes, and Horncastle Homes), their activity levels have been boosted over the last couple of years by their high exposure to the Canterbury market. The regional focus of some construction companies means that the disproportionate growth in consent numbers in Canterbury has skewed the mix of growth and boosted the concentration of building among larger Canterbury-based firms. But looking at the data for construction companies outside Canterbury, a resurgence in the market share of larger firms around the rest of the country is still apparent.
Over the last two years, the growing market share of the big players has mostly come at the expense of the market share of firms building nine or fewer houses per year, along with “owner-builders”.2 Over the longer term, however, it’s been the small and medium-sized firms that have been squeezed out of the market. The trend has been for growth in the market shares of firms building 80 or more houses per year and owner-builders. Even with the dip in the market share of owner-builders over the last two years, they are still contributing more of the consent total than at any time between 1997 and 2008.
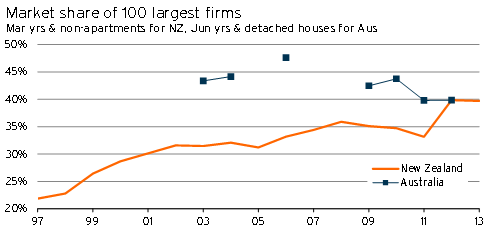
When compared with trends across the Tasman, the growth in the market share of the larger building firms has been remarkable. Back in 2002/03, the top 100 firms in Australia built 43% of new detached houses, with strong growth in the market share of the larger firms occurring in the mid-to-late 1990s. However, since 2006, the market share of larger firms in Australia has shrunk back to 40% (see Graph 5.7). The market share of the 100 largest firms is now almost identical on both sides of the Tasman.
Graph 5.7
Differences by firm size
It’s also important to understand, as best we can, the differences in building type across different firm sizes. For example, the Ministry of Business, Innovation & Employment provides estimated standard building costs to assist local councils with ensuring that realistic job values are provided with building consent applications.3 As part of these estimates, MBIE states that “group houses have been assessed as being, on average, 21 percent cheaper than speculative [one-off] houses, while architecturally designed houses are assessed as being 20 percent more expensive” on a per-square-metre (PSQM) basis. In other words, group home builders should be able to achieve some economies of scale, while architecturally designed homes are likely to face additional costs and may use more expensive materials, fixtures, and fittings.
It is also likely that the average dwelling size and quality varies by the type of builder or size of building firm.
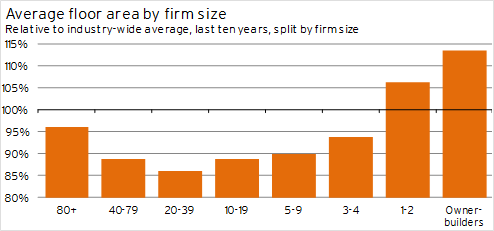
Data from Whats On Report allows us to look at the average floor area and the average PSQM cost by firm size. The results are shown in Graph 5.8 and Graph 5.9.
Graph 5.8
Graph 5.9
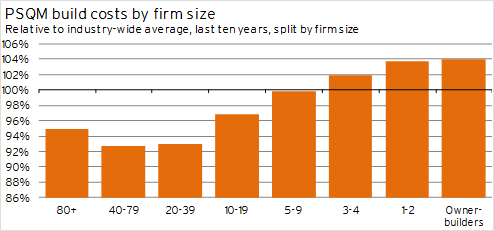
Over the last decade, dwelling consents for firms building 80 or more houses per year have had a PSQM cost 5.2% below the average for all new dwellings. However, these are not the cheapest dwellings on a PSQM basis, with consents for firms in the 20-39 and 40-79pa range more than 7% below the overall average. From there, the costs steadily rise as firm size gets smaller, to the point where PSQM costs for owner-builders are an average of 4.0% above the industry-wide average.
These results are consistent with the tenor of the MBIE estimates. Although the variation in costs from the Whats On Report data is less marked than in the MBIE estimates, it is important to note that our divisions by firm size are certainly not a perfect match for separating out group builders and architecturally designed houses.
If we look at the average floor area of dwelling consents by firm size in Graph 5.9, a similar pattern emerges. Over the last decade, the largest firms have built houses that are, on average, 4.1% smaller than the industry-wide average. The smallest homes have generally been built by firms with 20-39 consents per year (14% smaller than the overall average), while homes of owner-builders are typically 13% larger than the industry-wide average.
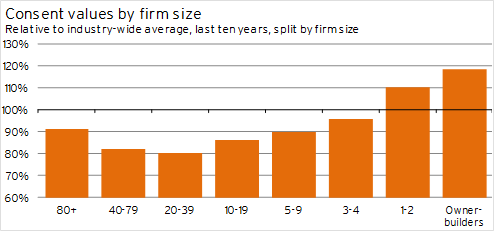
Combining these two sets of results means that the average consent value by firm size varies between 20% below the industry-wide average for firms with 20-39 consents per annum to 18% above average for owner-builders (see Graph 5.10). The largest firms, building 80 or more houses per annum, have an average consent value 9.1% below the industry-wide average.
Graph 5.10
Big player concentration
Given the similar concentrations of building activity among larger firms on both sides of the Tasman, at first glance it is questionable how much further the market share of the largest firms in New Zealand can increase. However, the push to improve productivity in the building sector would suggest that further consolidation of the industry is possible to help reduce costs and increase the capital intensity of house building activity. Any push towards greater standardisation and/or prefabrication of new houses will naturally favour the larger players in the industry.
The upward trend in the market share of larger construction businesses highlights the importance of building materials firms forming good relationships or strategic alliances with these companies. Being a preferred supplier to these larger firms represents an opportunity to be involved in the construction of more than a quarter of new dwellings, with that proportion likely to grow further in coming years. The pay-offs of relationship building at this end of the market are also much greater in terms of potential for growth, repeat business, and returns on the investment of personnel and time when compared with small firms or owner-builders.
With the bigger construction companies building slightly smaller houses than the market average, building material firms are likely to find that slightly lower volumes of their products are likely to be required on average when supplying these companies. Furthermore, the prices paid for those materials are also likely to be lower than average given the lower PSQM costs achieved by volume builders. However, the effects on the margins of manufacturers or suppliers may be limited given that the lower prices may be achieved by cutting out middlemen in the supply chain, and the efficiencies achieved by dealing with a smaller number of customers that offer higher total revenue prospects.


