Nelson-Tasman economic growth soars above national average
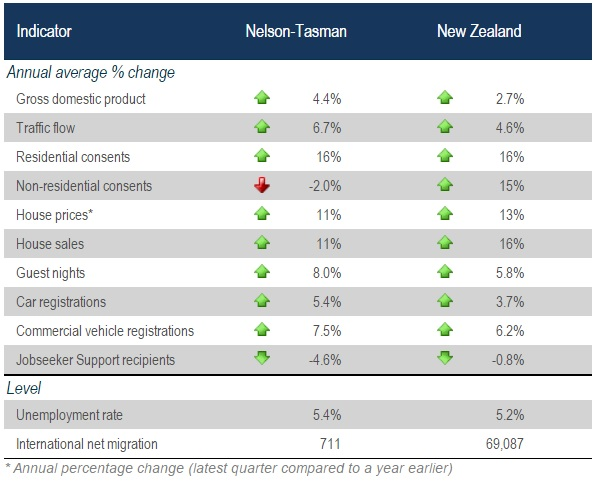
Nelson-Tasman’s economy grew quickly over the first half of 2016, with Infometrics’ provisional estimate of GDP showing growth in Nelson-Tasman of 4.4% over the June year, compared with estimated growth of 2.7% nationally.
Infometrics Senior Economist Benje Patterson says “Several factors have contributed to this growth, including increasing levels of building activity, a growing population, better conditions for primary sector exporters, and soaring visitor numbers into the broader region.”
“Against a backdrop of healthy job prospects, stable economic growth, and low interest rates, there has been renewed interest in Nelson-Tasman’s relatively affordable housing market.”
Infometrics’ Quarterly Economic Monitor for Nelson-Tasman shows house sales over the 12 months to June increased 11%, while house prices rose by 11%.
“Rising prices have lifted incentives to build, as evident by the 16% increase in residential building consents over the past year,” says Patterson.
“Although non-residential consents eased slightly, large scale projects, such as the proposed new airport terminal, are in the planning phases.”
Patterson says that another factor pushing up housing demand in Nelson-Tasman has been population growth.
“Evidence of people moving to the area can be seen in international migration statistics, which showed that Nelson-Tasman gained a net 711 migrants over the June year.”
“Higher levels of employment demand are one factor attracting people, a factor which has also seen the number of people in the region receiving Jobseeker Support fall by an average of 4.6% over the past year,” he says.
One of Nelson-Tasman’s fastest growing sectors this year has been tourism, with Infometrics’ estimates showing that tourism accounts for 10% of all employment across the region.
Guest nights in Nelson-Tasman over the 12 months to June climbed 8.0% to a record level.
“Nelson-Tasman has benefited not only from a rising flow of international visitors coming to New Zealand, but the introduction of Jetstar’s regional services in December and ensuing competition with Air New Zealand has seen a surge in people flying to the area.”
Data from Nelson Airport shows that a record 865,023 passengers flew through Nelson Airport in the year to June, up 16% on a year earlier.
Patterson expects tourism activity to continue climbing into 2017, but he cautions that “growth may be constrained by capacity bottlenecks at peak times.”
A growing population, better job prospects, and increasing visitor numbers have been good news for retailers in Nelson-Tasman.
Data from Marketview shows that the value of retail purchases on electronic cards over the June year was up 4.7% on a year earlier.
Patterson also identifies Nelson-Tasman’s primary sector as a star performer, saying that it has not faced the same challenges as regions with higher exposures to the dairy sector.
“Timber processors are enjoying strengthening demand from high levels of homebuilding activity across New Zealand, while seafood prices have risen,” he says.
Data from Seafood New Zealand shows that export prices for mussels over the first 6 months of 2016 averaged 13% higher than a year ago.
Pipfruit growers are also in good shape.
“Although hailstorms affected apple volumes earlier in the year, there has been some offset for growers due to higher prices,” says Patterson.
Patterson is also optimistic about the outlook for Nelson-Tasman’s primary producers and identifies the kiwifruit sector as one to watch.
“Not only have returns for kiwifruit growers been on the up, but a sharp increase in the cost of kiwifruit orchards in the Bay of Plenty is likely to raise interest in secondary kiwifruit growing areas such as Nelson-Tasman,” he concludes.
Table of economic indicators for the June 2016 year

The above are some insights from the recently updated Infometrics Quarterly Economic Monitor, a web-based monitor of regional economies that provides detailed analysis and commentary of spending, investment, and labour market activity at a regional and territorial authority level on a quarterly basis. For more information about the Quarterly Economic Monitor, click here.


