Infometrics’ building forecasts show that consents for new dwellings in New Zealand are expected to crack 35,000 by the end of 2019. This article looks at the size of our new housing, how it’s changed over time, and one potential approach to address the housing shortfall – and meet KiwiBuild targets.
Sizes peaked in the 2000s
Bigger was truly better in the 2000s, with average floor areas for new dwellings growing from 174m2 at the turn of the century to 200m2 in 2010. However, we’ve since eased back on the size front. Average floor areas eased to 170m2 in 2018, with the growing cost of construction and rising land prices trimming the buying power of those looking to build. There has also been a compositional shift, with more apartments and townhouses, which tend to be smaller than standalone houses.
The secret to building more houses
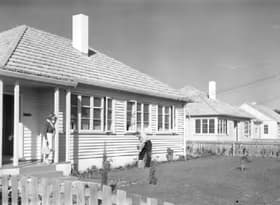
At 35,000 houses a year, it will take a long time to reach KiwiBuild’s target of 100,000 dwellings and make a dent in the housing shortfall without crowding out the rest of the construction sector. But we only need to hark back to the 1970s to find a solution. In 1974, we built 35,000 new houses with a much smaller population and workforce. The secret? Building smaller. The average new dwelling was a little under 110m2 (see Graph 1). The government heavily incentivized small and modest houses, with strict requirements including price caps for developers to access underwrites, and for families to access low-interest loans and capitalize their family benefit for the deposit.
If the average dwelling today was 110m2 , then the 5.6 million square metres of residential construction consented in 2018 could have been spread across 51,000 new dwellings instead of 33,000. KiwiBuild could be done and dusted in two parliamentary terms.
Graph 1
That said, we must acknowledge that smaller houses are more resource and labour-intensive, and thus more expensive per square metre. Smaller houses still need expensive rooms like kitchens and bathrooms, but have fewer less expensive rooms like bedrooms and living areas to bring down the overall cost on a square-metre basis.
Matching our houses to our households
While 110m2 might feel a little cramped by today’s standards, there’s a good evidential basis for shaving a bedroom or two off the average house. Since the 1970s, we’ve been building bigger and bigger houses at a time when our households are getting smaller and smaller. As of 2013, the typical household consisted of two usual residents, but the typical house had three bedrooms.
Graph 2 shows that the number of bedrooms and number of residents seems to be almost unrelated. These surplus bedrooms can’t be helping affordability for buying or renting. Not only that, but bigger houses cost more to keep warm, with the growth in floor area negating the impact of higher insulation requirements .
Graph 2
Construction is not just housing
In scaling up our construction sector to solve the housing shortage, we can’t forget the importance of non-residential construction. Just as we need more housing to accommodate a growing population, we need more shops, offices, schools, and factories to service and employ the growing population.
Since 2010, both residential and non-residential building activity has grown to reach record levels. The volume of residential work put in place has shot up by 72% while non-residential work has grown 30% (Graph 3). This growth has stretched resources across the industry, so further substantive growth in either subsector seems unlikely, lest we find a way to build more with less.
Graph 3

Subscribers to Infometrics Building Forecasts can access these via the Infometrics Portal. If you are interested in learning more, please get in touch with one of our team, or email Nick Brunsdon.


