Growing demand for public housing
Escalating housing costs across the country over recent years has put the squeeze on households, particularly renters on low incomes. This article looks at the demand for public (or social) housing, what’s being done about supply, and highlights emerging public housing hotspots across New Zealand.
Public housing?
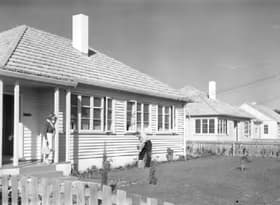
For most of us, public housing is a new term, but in reality it is simply what was previously known as social housing. In our analysis we include both houses owned by Housing New Zealand (HNZ) and community housing providers (CHP) that are subject to the Income Related Rent Subsidy (IRRS). Local authorities also provide public housing outside of the IRRS, but these numbers can be harder to track.
A lifeline for the poorest households
Public housing can be a lifeline for our poorest households. In 2017, the average weekly household income for public housing tenants, was $414 after tax, and under the IRRS, their average rent was $121. After their subsidised rent, that leaves a meagre $293 to pay for food, power, transport and all other costs. To put these figures in context, average weekly income for a full-time minimum wage earner was $540 after tax in 2017, and the average weekly household income was $1,863 after tax.
Unsurprisingly, increasing housing unaffordability has led to a tripling in the number of households on the public housing register (waiting list), from 4,630 in June 2014 to 12,311 in June 2019 (see Graph 1). Households on the waiting list report even lower incomes than those already living in public houses – an average household income of $342 after tax in 2017.
Graph 1

How much housing is out there?
Pinning an exact number on public housing can be challenging – over the years there have been many reclassifications and transfers of ownership which make it harder to count but don’t affect availability or rents. For example, in 2017, 1,200 houses in Tauranga were sold by HNZ to a CHP, but existing tenants retained their tenancies and subsidised rents under the IRRS. As of June 2019, there were 66,200 tenancies under the IRRS – including HNZ and CHP – plus around 8,000 tenancies in council houses across the country outside the scheme.
HNZ managed stock has eased back from a peak of 69,700 in June 2011 to 63,000 in June 2019, as a result of transfers to CHPs, demolition of stock following the Canterbury earthquakes, and sales to private owners in areas considered to have low demand.
Growing and revitalising the stock
Throughout the 1990s and 2000s, central government (predominantly through HNZ) typically built under 500 new houses per year. However, damage to stock in the Canterbury earthquakes and growing demand in Auckland led to a strong increase in construction, with 2,000 new dwellings consented each year over the past two years (see Graph 2). These are gross figures, and in many cases the new dwellings are replacing older state houses that are not fit for purpose. In net terms, HNZ plans to add around 5,000 additional new houses in Auckland, and 5,000 across the rest of the country, over the next ten years.
Graph 2

Public housing hotspots
Demand for public housing has followed the ‘Mexican wave’ of housing unaffordability, spreading from Auckland across the Golden Triangle, to the main centres and then everywhere in between.
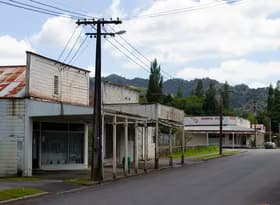
Unfortunately, public housing supply has been slow to respond, and as a proportion of occupied dwellings, national demand for public housing has more than doubled in the past two years. Demand has grown even faster in some regional towns and cities – with the public housing register (waiting list) now representing more than one percent of all occupied dwellings in Gisborne, Porirua, Napier, and Palmerston North (see Graph 3).
Graph 3

On a per household basis, Auckland is the tenth ranked local authority for public housing demand as of March 2019 (see Graph 4), and the top ten has changed very little since March 2017. Within the top ten, Rotorua and Kawerau have replaced Whakatane and Opotiki since 2017.
Graph 4

It’s important to bear in mind that as the waiting list grows, households might be reluctant to ‘join the queue’, knowing that their chances of getting a public house are slim. As a result, it may under-estimate need in areas of strong demand.
Looking ahead
House price growth is starting to pick up again, and we expect it to continue into next year, fueled by easing loan-to-value restrictions and a further cut to the official cash rate. Low interest rates have improved returns on rental properties, and we think that investors chasing yields will limit growth in rents over the next 1-2 years.
For low income households, the situation is unlikely to get better, as even modest growth in rents will eat into tight budgets, especially those dependent on benefits. This may send more households onto the public housing register.


